Historical examples
The standard view
An alternative view of hyperinflations
Historical examples
Conclusions
An alternative view of hyperinflations
However, there is an alternative view of hyperinflations, one that I find much more credible than the quantity theorybased argument outlined above. This alternative viewpoint recognizes that money supply is endogenous (and hence that interest rates are exogenous), and that budget deficits are often caused by hyperinflations rather than being the source of hyperinflations.
If simply “printing money” really did lead to hyperinflations, then we should expect to see hyperinflations all of the time. Any government that issues its own currency under a floating exchange rate effectively spends by printing money (7) (as a matter of logic, if the government is the sole issuer of currency, it has to spend before it can collect any taxes at all, otherwise there is nothing to pay the taxes with). Yet, rather than two-a-penny, hyperinflations are thankfully rare events, representing occasions when populations lose complete faith in their currencies.
So if “printing money” isn’t a helpful hallmark of the hyperinflationary experiences we have witnessed, what is? When looking across the historical sampling of hyperinflations, several common characteristics (8) stand out:
1. Large supply shocks. Often, but not always, wars of one form or another cause large supply shocks. Regime change is also often seen as a cause. The role of supply shocks is critical in the creation of hyperinflations.They represent a hit to potential output and thus are a key mechanism for creating the excess demand so often seen during hyperinflations.
If we think in terms of the quantity theory expression MV = PY, then the output shock is modeled by a big drop in Y, which, given unchanged M and V, means that P has to rise in order to maintain the relationship. Of course, unchanged V and M are not good assumptions as we will see, but note that the monetarist interpretation of the quantity is completely backwards.
The clearest explanation of the importance of supply shocks comes from Bill Mitchell.(9) He uses the following simple diagram and accompanying text to make his case.
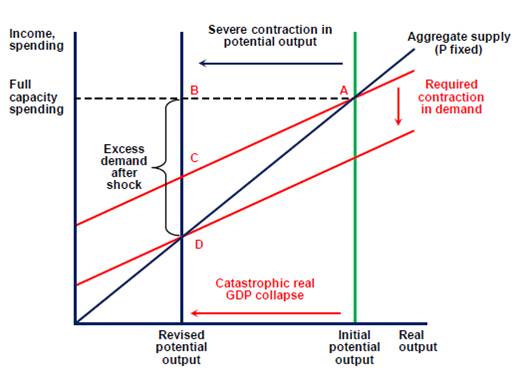
“It is not perfect but makes the point (you have to impose your own dynamic motion on the chart). The horizontal axis is real output and full-employment potential output is shown by the vertical green line (inferring no biounsustainable production levels!). The vertical axis is spending or demand in real terms. The trick is that the price level is held constant in this diagram. The 45 degree line is the fixed-price aggregate supply curve indicating that firms will supply whatever is demanded at the fixed price up to capacity (Point A). After Point A, supply capacity would be exhausted and inflation would enter the picture.
The red line (top) which intersects Point A is the aggregate demand line and shows the current state of spending in the economy at different real income levels. It is upward sloping because consumption rises with national income and it is less than 45 degrees because not all income is consumed (some saving). So it is the sum of all demand components (consumption, investment, net exports and government spending).
If we assume that Shangri la prevails then we are initially at Point A. There will be full capacity output, stable prices, some non-government saving and a budget deficit to match.”
Now imagine that some supply shock occurs:
“Potential output would steadily contract and I have shown a particular revised potential line (a contraction of the overall capacity of the economy to produce).
If you think about current demand levels in relation to that new dramatically reduced supply potential you quickly see there is a huge excess demand (spending) measured by the gap between points B and D. But, in fact, as the income levels fall, the economy would actually contract along the top red aggregate demand line (as income falls, so does consumption and saving). At point C there is still excessive demand (spending) in relation to the new potential capacity.
So demand would have to be reduced downward (red line shifting down) until it intersected the new supply constraint at the 45 degree line at point D. Point C could theoretically be associated just as much with a budget surplus as a budget deficit – that is, you cannot directly implicate the conduct of fiscal policy with the excess spending automatically or even necessarily.
The upshot is that price level would be rising in this economy long before it reached point D from point A because of the chronic excess spending relative to the dramatically lower capacity.”
2. Big debts denominated in a foreign currency. This practice leads to the devaluation of the currency, which in turn leads to the rising price level. Quantity theorists argue the reverse causation.
3. Distributive conflict/transmission mechanism. Crucially, the need for this element was pointed out by Joan Robinson(10) in 1938. She wrote “Neither exchange depreciation nor a budget deficit can account for inflation by itself. But if the rise in money wages is brought into the story, the part which each plays can be clearly seen. With the collapse of the mark in 1921, import prices rose abruptly, dragging home prices after them.
The sudden rise in cost of living led to urgent demands for higher wages. Unemployment was low . . . profits were rising with prices, and the German workers were faced with starvation. Wage rises had to be granted. Rising wages, increasing both home costs and home money incomes, counteracted the effect of exchange depreciation in stimulating exports and restricting imports. Each rise in wages, therefore, precipitated a further fall in the exchange rate, and each fall in the exchange rate called forth a further rise in wages. This process became automatic when wages began to be paid on a cost-of-living basis.”
Without this form of transmission mechanism, hyperinflations would simply flare out.
Understanding these factors helps to explain why saying that hyperinflations are the result of printing money just isn’t helpful; it is too simple and misses the major drivers of hyperinflations. The monetary response is endogenous to the process, not a driving force. As Robinson opined in her review, “A clear grasp of the distinction between a necessary and a sufficient condition seems to be all that is required to settle the controversy. It is true that a train cannot move when the brake is on, but it would be foolish to say that the cause of motion in a train is that the brake is removed.”
As Raul Prebisch(11) put it, “The general mistake persists of considering inflation as a purely monetary phenomenon... Inflation cannot be explained as something divorced from the economic and social maladjustments and stresses to which the economic development of our countries gives rise.”Let’s look at some historical examples(12) and see how they map against the common characteristics mentioned above. I’ve tried to pick a broad mixture of hyperinflations across a wide range of history. Often hyperinflations have occurred in groups (hardly surprising because many of the large supply shocks witnessed have taken the form of wars, hence encompassing more than one nation), so I’ve generally just picked one country from any group to provide a sketch of the conditions under which hyperinflations tend to arise.
Historical examples
7 Keystrokes would be a better description of printing money these days.
8 A database of hyperinflation experiences has recently been compiled by Steve H. Hanke and Nicholas Krus, “World Hyperinflations,” 2012. See the Appendix and visit http://www.cato.org/sites/cato.org/files/pubs/pdf/WorkingPaper-8.pdf.
9 Bill Mitchell – billy blog at http://bilbo.economicoutlook.net/blog/?p=3773
10 Joan Robinson, “The Economics of Hyperinflation,” a review of Bresciani-Turroni’s The Economics of Inflation,” Economic Journal, No. 48, September 1938.
11 Raul Prebisch, “Economic Development or Monetary Stability: The False Dilemma,” 1961. If you don’t know of Raul Prebisch, he is quite probably the greatest economist you have never heard of. He is often, quite correctly, referred to as Latin America’s Keynes.
12 These thumbnail sketches can’t possibly do justice to the experience of hyperinflations and leave out many important details, but hopefully they will illustrate the common characteristics of hyperinflations.