"Russian stocks advanced more in price than American stocks between 1864 and 1914, but American companies paid larger dividends. Price and dividends offset each other and during that 45-year period, the two stock markets provided approximately equal returns."
Dr. Brian Taylor
Global Financial Data, 21 March 2018
Global Financial Data has put together indices of the St. Petersburg Stock Exchange before World War I and the collapse of Russia into Communism. The data was made available to us from Yale’s International Center for Finance.
The files were marked in transliterated Cyrillic, so we converted the names back into Cyrillic and then translated the names of the companies into English. We then classified the stocks according to their sector so we could see how one sector did relative to the others.
Although the data from Yale was rich in price data, it was lacking in shares outstanding and dividends. The source material that Yale collected only had information on capitalization in the first issue. None of the other issues provided any information on either capitalization or shares outstanding. Except for a few issues around 1900, no data on dividends was available either, and having dividend data for four or five years was hardly sufficient to create a useful total return series.
Common Stock and Scrip
Every stock market has its own peculiarities and one of the interesting facts about the St. Petersburg Stock Exchange is that over time, banks, railroads and other firms raised more capital by issuing new shares as in any other country; however, the newly issued shares traded alongside the original shares. All of the issues would trade simultaneously on the St. Petersburg Stock Exchange, even though the price of each was virtually the same. The St. Petersburg-Tula Land Bank had 15 issues trading simultaneously, the Don Land Bank 14 and the Bessarabsko-Tavrichesky Land bank 19. In all, there were over 150 issues of scrip that traded alongside the mother shares for each company.
Once these issues were designated as scrip, rather than common shares, this left about 425 different companies that traded on the St. Petersburg Stock Exchange between 1865 and 1917, some for a few months, some for the entire 52 years. The St. Petersburg Stock Exchange shut down in August 1914 when World War I began, briefly reopened in 1917, then shut down for the next 75 years when the Russian Revolution began.
The goal of organizing this data was to produce indices which could be used to analyze the Russian stock market. The source material from Yale principally relied upon St. Petersburg, but quotes from the Moscow, Kiev and Warsaw exchanges were provided as well. Of course, before World War I, the Russian Empire included not only Russia, but the Baltic states, Poland, and Ukraine.
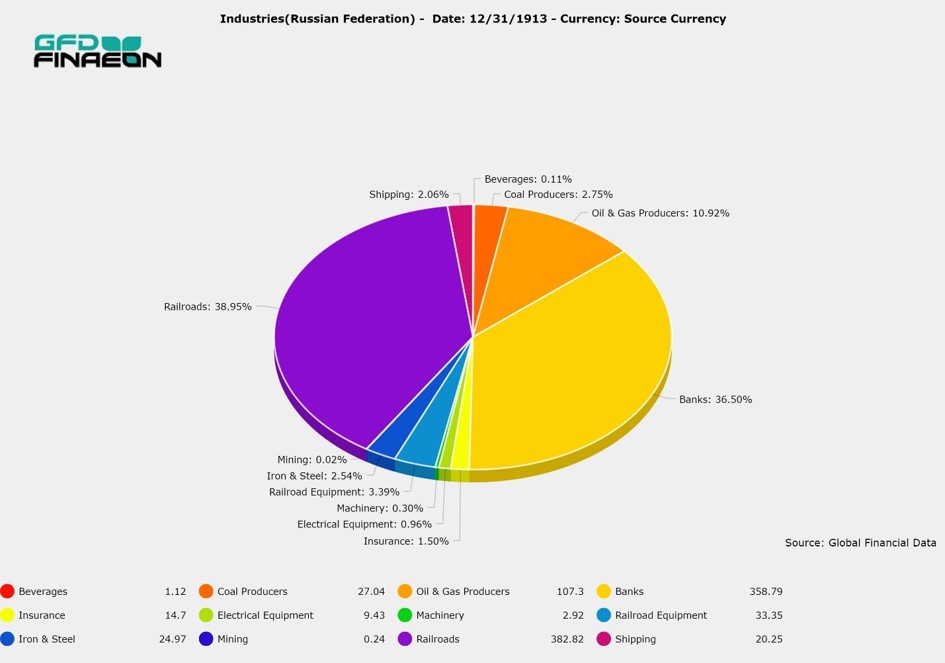
The principal industries were banks and railroads with oil companies, utilities, mining, insurance and iron and steel companies providing most of the capitalization. Russia tried to follow Germany’s lead by infusing capital into the banks and railroads to enable the country to industrialize. The railroads relied heavily on bonds as well as common stocks to raise capital for a network of railroads to crisscross the empire. Russia also relied extensively on infusions of capital from Germany, France and Britain to fund the country’s transformation. Of course, when the Communists took power, all the shares became worthless, though foreign-listed companies continued to trade in Paris and Berlin until the 1920s.
Creating Indices
Our first step was to create a Russian index that included all the companies that traded in St. Petersburg, an All-Share index, but we also wanted to create an index of Russian “blue chip” stocks. We did this by finding the 50 stocks with the largest number of months traded and created an index of the 50 top companies.
Because we had no data on shares outstanding, the index had to be equal-weighted meaning that a small cotton factory had the same weight as the largest railroad or bank in the country. To try and address this issue, we collected capitalization data from two stock exchanges where Russian shares also traded, in Paris and in Berlin. We were able to collect data on 68 companies that listed in St. Petersburg and abroad. Of course, the primary companies that listed abroad were the larger blue-chip companies. When we summed up the capitalization of these companies in 1913, it came to $982 million (1910 million Rubles). Our 1900 figure of $486 million is about one-third of the estimate made by Leslie Hannah. The three main sectors in 1913 were railroads (40%), finance (38%) and energy (14%).
The final question that remained was what the total return was to investors, including dividends that were paid out. Again, we turned to the Berlin Stock Exchange yearbook which had data on historical dividends. Unfortunately, data on only 20 companies was included, but this could at least give us some insight into the total return to shareholders. The dividend yield was actually quite low, with companies only paying 3% on average in many years because some of the railroads paid no dividend at all.
Russian Stock Price Indices
To the right is a graph that compares the four indices that we calculated for Russia between 1870 and 1914. The ranking of the returns puts the 50-share Blue Chip index at the bottom, the All-Share Equal Weighted index next, then the Cap-weighted index and finally, the Dividend only stocks at the top.
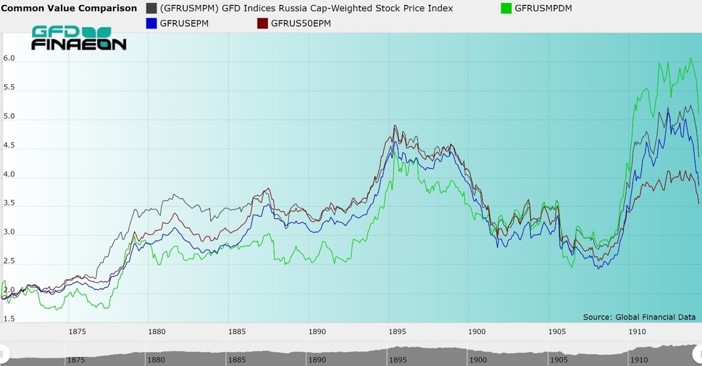
Generally, it is thought that equal-weighted indices will outperform cap-weighted indices because of the larger weight given to smaller companies. Of the four indices, the 20-share Dividend index (GFRUSMPDM) provided the highest return, followed by the Cap-weighted index (GFRUSMPM), the Equal Weighted Index (GFRUSEPM) and the Top 50 Blue Chip Equal Weighted Index (GFRUS50EPM). Russian railroad stock moved up sharply between 1908 and 1914 and since the Dividend index relied more heavily on the railroads than the other indices, this is reflected in the index’s outperformance.
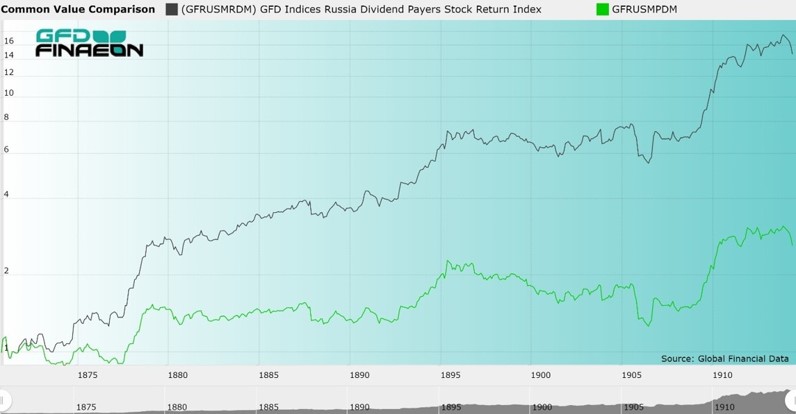
Adding Dividends
The All-share equal weighted index had an average appreciation of 2.43% between 1865 and 1914, and the Top 50 index an average appreciation of 2.39%, which was virtually the same. The Cap-weighted index returned 2.52% between 1865 and 1914 and 1.86% between 1870 and 1914. The 20-stock dividend index returned 2.22% per annum between 1870 and 1914. On average, the dividend yield was 4.02% between 1871 and 1914 and after adjusting for dividends, the total return between 1870 and 1914 was 6.31% per annum.
Despite the differences in the indices, the general trends remain the same. There is a slow general uptrend between 1865 and 1895, a general decline until 1905 when Russia lost the Russo-Japanese war and the 1905 Russian Revolution occurred, then a stabilization to around 1908 and a large move upward in the last six years before World War I begins.
Russian Sectors
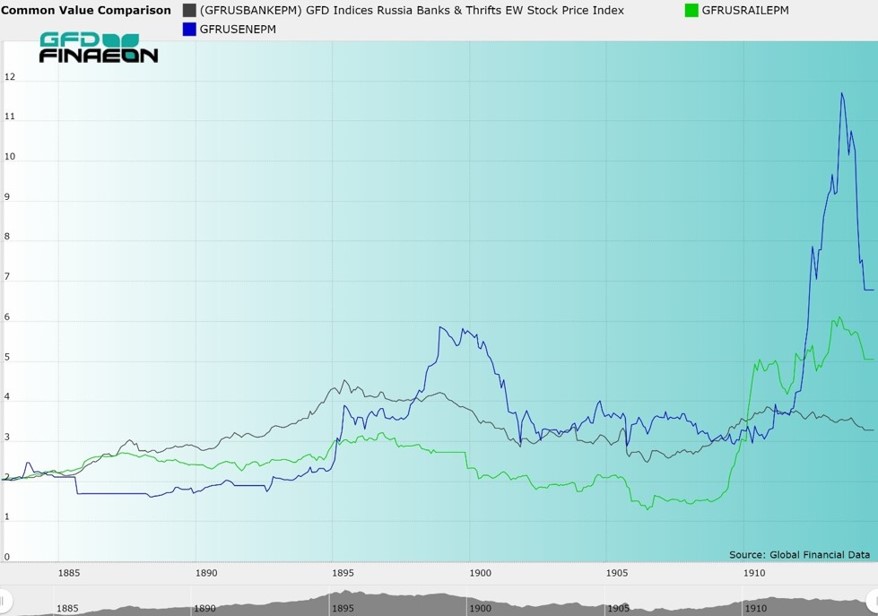
If you study the different sectors, you’ll see that the Bank Index (Black line) never recovered to the 1895 peak, even by 1914. The Railroad (green line) and energy sectors (blue line), however, moved up significantly. Between 1865 and 1905, Russian Railroads made no progress, but between 1905 and 1912, the railroads more than tripled in price. The best performance came from the oil and gas industry which made significant gains in the 1890s and the 1910s. Since the cap-weighted index included more railroad and energy shares than the St. Petersburg stock market in general, this provides the best explanation for the outperformance of the cap-weighted indices over the equal-weighted indices.
Russia and the United States
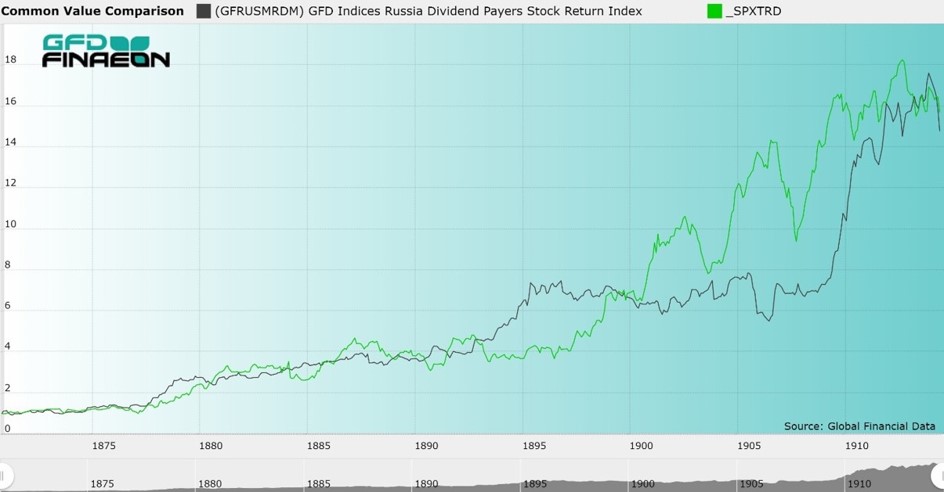
Finally, a comparison was made between the total return to shareholders in the United States and in Russia between 1870 and 1914. Previous comparisons showed that the Russian index had outperformed the American index, but this only compared the prices of the stocks and excluded the dividends that were paid. Russian stocks advanced more in price than American stocks between 1864 and 1914, but American companies paid larger dividends. Price and dividends offset each other and during that 45-year period, the two stock markets provided approximately equal returns. The American and Russian stock markets are compared below.
Conclusion
The result is as complete of a picture of the Russian Stock Exchange before World War I as currently exists. To our knowledge, no one else has generated either a cap-weighted or a total return index for Russia before World War I. We hope we can get more data on shares outstanding and on dividends in the near future. Of course, by 1918, all of the Russian shares were worthless, but in the meantime, these numbers will have to stand as the best that are available for Russia before the Revolution.